Catch and Release Population Estimate
Collaborators:
Sam Freeman and Damian Hupka,as well as Environmental Science 1st Period Class
Abstract:
To most accurately estimate a population size using a method known as tagging, an experiment was conducted which measured the effects of both number tagged and number of catches on the percent error of the estimate population compared to the actual. This experiment consisted of a paper bag which represented the ocean, a large amount of beads which represented fish, and a smaller amount of beads of a different color which represented tagged fish. The results of the experiment were that both a lower number tagged and a lower number of catches yielded a more accurate population estimate (although the validity of the data is questioned). More specifically, 30 tagged yielded a 15.65 percent error while 10 tagged yielded only a 9.57 percent error. Furthermore, 30 catches yielded a 13.535 percent error while 10 catches yielded only a 9.96 percent error.
#tagged
Problem:
According to Michael J. Gregory, Ph.D., "special techniques may be required to measure animal populations... which enable investigators to estimate numbers of animals without having to census an entire population." Using a method commonly used by biologists known as tagging, determine which catch size and number of catches yields the most accurate estimate of a population size.
Hypothesis:
If the percent error of population estimates using different catch sizes and numbers of catches is measured, then it will be found that a larger catch size and larger number of catches yield more accurate results, with the later having the most influence.
Parts of the Experiment:
The independent variables were how many fish were tagged and how many catches were done. The dependent variable was the percent error of the population estimate. There was not really a control group although the actual population size sort of acts as one despite it not being a group. There was also not really an experimental group besides the population estimate (although it is not a group as well).
Materials:
About 200 beads of one color, at least 30 beads of a different color, a paper bag
Methods:
1. Remove a sample catch of either 10, 20, or 30 beads from the paper bag
2. Replace the sample catch with different color beads to represent the tagging
3. Shake the bag and randomly draw out a handful of beads
4. Do this either 10, 15, or 20 times while being sure to record the total number of beads withdrawn and how many of them were tagged
5. Calculate the percent tagged for each catch and average them together
6. Use this number to estimate the population size (population size = number tagged / mean of the sample percentages)
7. Record the actual population size and then calculate the percent error
Data:
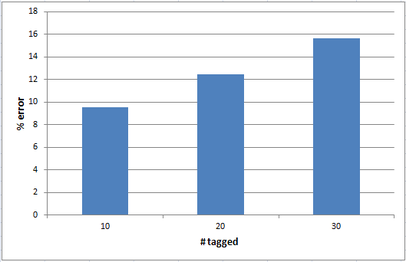
Pictured above is a graph of the average percent error for each different number tagged.
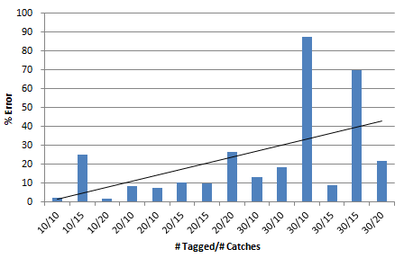
Pictured above is a graph showing the percent error of the population estimates created from using all the different combinations.
|
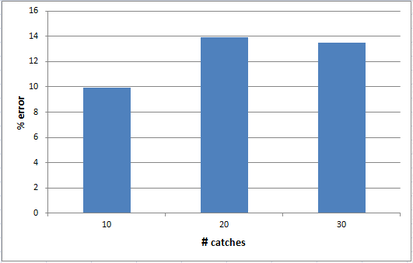
Pictured above is a graph of the average percent error for each different number of catches.
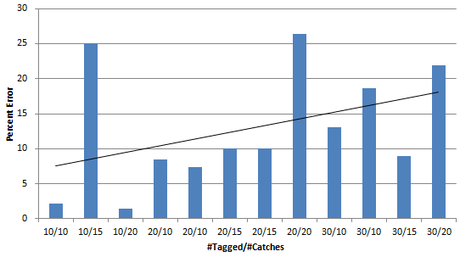
Pictured above is the same graph without the two outliers, which are most likely inaccurate data.
|
Data Analysis:
It appears that, as the number of tagged increases, the percent error increases as well. This means that tagging more fish yields a less accurate population estimate. The same can be said for the number of catches (although there is actually a decrease in error from 20 to 30 catches but it is a very small decrease). So the more catches that are done, the less accurate the population estimate will be. Unsurprisingly, the two variables combined (the bottom two graphs) supports the same trend that more tagged and more caught equal less accuracy, even when the outliers are omitted.
It is also of note that the data supports the idea that number tagged is a more influential factor than number of catches, as the percent error changes two percent more on the graph with number tagged. In other words, the percent error changes about six percent as the number of tagged increases from 10 to 30 while the percent error only changes four percent as the number of catches increases by the same amount.
Conclusion:
The results are contrary in every possible way to my hypothesis. I predicted that tagging more fish and doing more catches would create a more accurate population estimate and that the number of catches was the more influential of the two factors. The data completely goes against this, yet the validity of said data is highly questionable. The reason for this being that it simply does not make logical sense that an increasing number of catches, especially, decreases the accuracy of a population estimate. The more catches done, the more accurate the estimate will be because the catches are basically just trials and the more trials done causes data to be increasingly accurate. I also feel the same way for number tagged because only tagging a small amount of fish/beads would leave a lot up to chance and thus not result in a very accurate estimate.
If this experiment was to be redone, there are a couple of things that would need to be done to ensure more accurate data. Firstly, there needs to be more trials, at least 10 for each number tagged and number of catches. This was a problem in the original experiment where, for example, there were only two trials done for ten beads tagged. Secondly, all math done needs to be double checked. This problem is evident in the original experiment through the two outliers (70% and 87% error). It would also be nice to try a little bit wider range of numbers instead of just 10-30. Perhaps 5-40 would work better.
Citations:
Gregory, Michael J. "Estimating Animal Population Size Using Mark-Recapture Techniques."Clinton Community College. N.p., n.d. Web. 05 Nov. 2013. <http://faculty.clintoncc.suny.edu/faculty/michael.gregory/files/ENV 101/ENV 101 Laboratory/Mark-Recapture Sampling/lincoln instructions-dried bean version.htm>.
