Air Quality Lab
Collaborators:
Sam Freeman and Ethan Lee
Abstract:
The Avril Gulf Tuna Population Simulator program was used to determine the impact of specific limiting factors including fishing, predators, lack of food, and lack of migration on a population of fish. In the controlled environments of the simulator, it was determined that these previously mentioned limiting factors cause the fish populations to either increase at a slower rate than normal, have a smaller carrying capacity, or even go extinct. To provide specific examples, a lower rate of migration did not decrease the carrying capacity but did cause the rate of growth to decrease. Furthermore, a smaller carrying capacity was reached when only a small amount of food was available and when there were many predators. Lastly, the population of tuna fish went totally extinct when fishing was done at a medium rate throughout the year.
Problem:
According to nhptv.org, "limiting factors like the availability of food, water, shelter and space can change animal and plant populations." How exactly are the populations changed? In other words, what are the effects of limiting factors on a simulated population of tuna?
Hypothesis:
If certain limiting factors such as a decrease in the amount of food, an increase in the amount of fishing, and an increase in the amount of predators are introduced into a simulated population of fish, then the population will not increase as quickly or may even go extinct.
Parts of the Experiment:
The independent variables were: reproduction rate, death rate, migration, amount of predators, amount of food, and the amount of fishing. The dependent variable was the population of fish. The controls were the normal population growth in each stage. The experimental groups were the simulations where the default settings of the limiting factors were altered.
Materials:
Computer, Avril Gulf Tuna Population Simulation Program
Methods:
1. Access a computer
2. Launch the Avril Gulf Tuna Population Simulation Program
3. Complete stage 1 and observe how reproduction, death, and migration rates affect the population
4. Complete stage 2 and observe how predators and food supply affect the population
5. Complete stage 3 and observe how fishing affects the population
6. Complete stage 4 and observe how all these factors combined affect the population
Data:
Stage One:
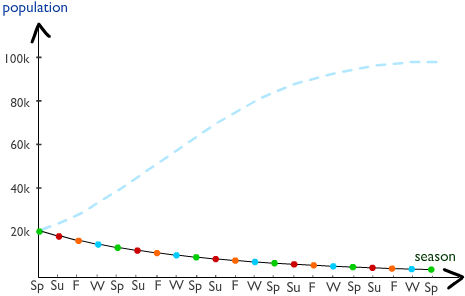
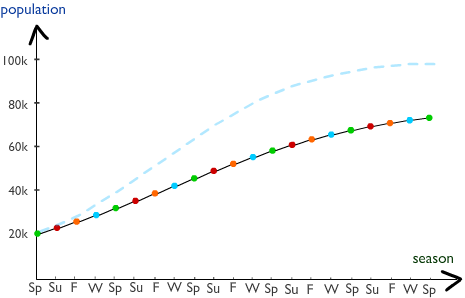
A high rate of reproduction causes the population to increase extremely fast but still level off at 100,000, the carrying capacity of the environment. Also, the population will reach the carrying capacity even when the death rate is high although this will take a little longer. The data for migration rates can be seen on the graphs below (high rate of migration is on the left graph and low rate is on the right graph).
Collaborators:
Sam Freeman and Ethan Lee
Abstract:
The Avril Gulf Tuna Population Simulator program was used to determine the impact of specific limiting factors including fishing, predators, lack of food, and lack of migration on a population of fish. In the controlled environments of the simulator, it was determined that these previously mentioned limiting factors cause the fish populations to either increase at a slower rate than normal, have a smaller carrying capacity, or even go extinct. To provide specific examples, a lower rate of migration did not decrease the carrying capacity but did cause the rate of growth to decrease. Furthermore, a smaller carrying capacity was reached when only a small amount of food was available and when there were many predators. Lastly, the population of tuna fish went totally extinct when fishing was done at a medium rate throughout the year.
Problem:
According to nhptv.org, "limiting factors like the availability of food, water, shelter and space can change animal and plant populations." How exactly are the populations changed? In other words, what are the effects of limiting factors on a simulated population of tuna?
Hypothesis:
If certain limiting factors such as a decrease in the amount of food, an increase in the amount of fishing, and an increase in the amount of predators are introduced into a simulated population of fish, then the population will not increase as quickly or may even go extinct.
Parts of the Experiment:
The independent variables were: reproduction rate, death rate, migration, amount of predators, amount of food, and the amount of fishing. The dependent variable was the population of fish. The controls were the normal population growth in each stage. The experimental groups were the simulations where the default settings of the limiting factors were altered.
Materials:
Computer, Avril Gulf Tuna Population Simulation Program
Methods:
1. Access a computer
2. Launch the Avril Gulf Tuna Population Simulation Program
3. Complete stage 1 and observe how reproduction, death, and migration rates affect the population
4. Complete stage 2 and observe how predators and food supply affect the population
5. Complete stage 3 and observe how fishing affects the population
6. Complete stage 4 and observe how all these factors combined affect the population
Data:
Stage One:
A high rate of reproduction causes the population to increase extremely fast but still level off at 100,000, the carrying capacity of the environment. Also, the population will reach the carrying capacity even when the death rate is high although this will take a little longer. The data for migration rates can be seen on the graphs below (high rate of migration is on the left graph and low rate is on the right graph).
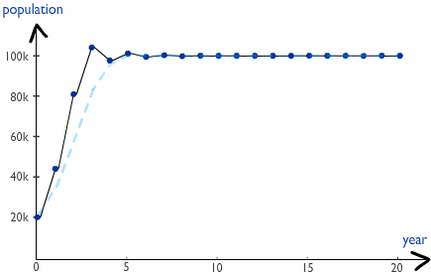
|
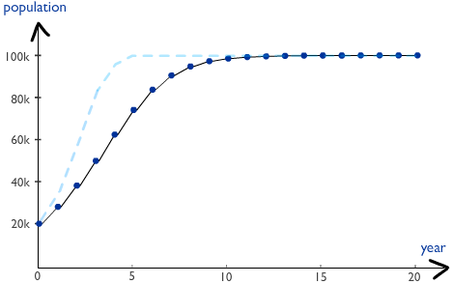
|
Stage Two:
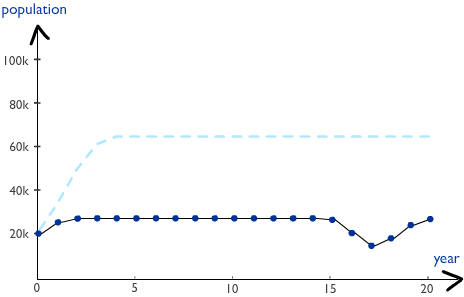
Abundant amounts of food and no predators allows the population to reach the normal carrying capacity (100,000) and stay there, except for in times of disease and pollution. Abundant amounts of food and many predators causes the population to hover around 20,000. Low amounts of food and few predators can be seen on the bottom left graph. Low amounts of food and many predators can be seen on the bottom right graph.
Abundant amounts of food and no predators allows the population to reach the normal carrying capacity (100,000) and stay there, except for in times of disease and pollution. Abundant amounts of food and many predators causes the population to hover around 20,000. Low amounts of food and few predators can be seen on the bottom left graph. Low amounts of food and many predators can be seen on the bottom right graph.
|
|
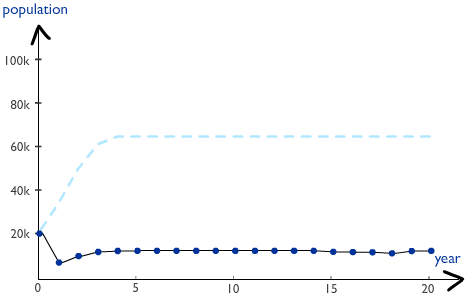
Stage Three:
Medium fishing in only one season causes the population to slowly zigzag upwards. Medium fishing in two seasons causes the population to zigzag as well but stay at the starting population of 20,000. Medium fishing in three seasons causes the population to slowly zigzag towards extinction. Medium fishing in all four seasons can be seen below on the bottom left graph. Light fishing in only one season causes the population to increase almost at a normal rate. Light fishing in two seasons causes the population to increase at a slightly slower pace. Light fishing in three seasons still shows a population increase but at a much slower rate. Light fishing in all four seasons can be seen below on the bottom right graph. Heavy fishing in even one season eventually causes the population to go extinct.
Medium fishing in only one season causes the population to slowly zigzag upwards. Medium fishing in two seasons causes the population to zigzag as well but stay at the starting population of 20,000. Medium fishing in three seasons causes the population to slowly zigzag towards extinction. Medium fishing in all four seasons can be seen below on the bottom left graph. Light fishing in only one season causes the population to increase almost at a normal rate. Light fishing in two seasons causes the population to increase at a slightly slower pace. Light fishing in three seasons still shows a population increase but at a much slower rate. Light fishing in all four seasons can be seen below on the bottom right graph. Heavy fishing in even one season eventually causes the population to go extinct.
|
|
Stage Four:
This stage simply combines elements from the other stages and thus no new data is present.
Data Analysis:
From the data, it can be determined that lack of migration, lack of food, increase in predators, and fishing are all limiting factors. The reason for this is that they limit population growth and decrease the carrying capacity. For example, a low amount of food and few predators (stage two) caused the carrying capacity to be about 26,000 while a low amount of food and many predators caused the carrying capacity to be about 13,000.
As evident from the data gathered in stage three (bottom left graph), it can be seen that over-fishing will lead to the extinction of the fish population in an environment. Because of this, fishing must be done at an appropriate rate. This could mean light fishing done in all seasons or medium fishing done in just one season, both of which result in about 70,000 fish living in the environment.
Conclusion:
As stated in the hypothesis, the introduction of limiting factors such as a decrease in the amount of food, an increase in the amount of fishing, and an increase in the amount of predators into an environment of simulated fish will cause the population to be negatively affected. This might mean extinction, a smaller carrying capacity, or just slower growth.
If this experiment was not a simulation and a real population of fish was used instead, the results would not be as definite. To elaborate, carrying capacities and rates of growth would vary. The reason for this is because there are many more variables in real fish environments than just the basic ones used in this simulation. For example, changes in the pH and salinity of the water would also impact the population of fish.
Citations:
"Limiting Factors." NatureWorks. N.p., n.d. Web. 27 Sept. 2013. <http://www.nhptv.org/natureworks/nwep12a.htm>.
Conclusion Questions:
Stage One:
1. What are the limiting factors?
Lack of migration and death.
2. What is your carrying capacity?
The carrying capacity is about 100,000 fish.
Stage Two:
3. What happened immediately when pollution occurred?
The population dropped drastically (about 30,000).
4. How long did it take the population to recover after pollution occurred?
Normally about 4 or 5 years.
5. What happened immediately after disease occurred?
The population dropped a medium amount (about 20,000).
6. How long did it take the population to recover after disease occurred?
Normally about 2 or 3 years.
Stage Three:
7. Some fishing will occur, as humans interact with the environment. Find a pattern that will allow the tuna population to remain at a carrying capacity of 60,000. What fishing regulations would maintain this population size?
Relatively low fishing through the year (about the third setting). Harsh fishing regulations would maintain this population.
Stage Four:
8. What factors allowed for the maximum amount of fishing while maintaining the fish population? Record the greatest amount of fishing allowable.
A high rate of reproduction, a low rate of death, a high rate of migration, few predators, and lots of food allow medium fishing in every season of the year while keeping the tuna population normal.
9. Which factors are density-dependent and which are density-independent?
Death is dependent on density because as density increases, more fish die. Migration is also density dependent because the fish will move if it is crowded. Reproduction is independent. Predators and food are density-independent in this lab as well. Disease and pollution are density-dependent as well because as the population increases, they become more common.
10. How could a model, such as this simulation, help fisheries biologists make recommendations about setting fishing limits? Explain your answer.
The biologist could experiment with this simulation and see how much fishing can be done that still keeps the population at a normal level. They would probably use prior knowledge about the reproduction rate, migration, and available food of the fish to get an accurate answer.
